Dear Clients & Friends,
Inflation remains a primary economic concern and driver of recent market volatility. The Federal Reserve has indicated that bringing down the rate of inflation will require higher short-term interest rates and plans to continue aggressive rate increases through the remainder of the year. The yield curve1 has risen accordingly, and credit spreads2 have widened; thus, financial asset valuations have declined. This is reminiscent of the 1970’s period of “stagflation,” characterized by low economic growth coupled with high inflation. For the 10-year period beginning January 1, 1973 through December 31, 1982, the compounded total return for the S&P 500 was 6.7% annualized.
We view this as a relevant comparison in evaluating the current market opportunity set and continue to focus on companies which we believe have a strong industry position and pricing power. Financial market volatility presents an opportunity to purchase companies at more reasonable valuations, adding to our ability to deliver long-term results for our clients. Over the past two years, a number of high-quality companies which met our investment criteria were unattractively priced relative to our estimate of intrinsic value. We have used recent market declines to add and consolidate positions in our highest-conviction ideas.
VELA Fund Returns (as of June 30, 2022)
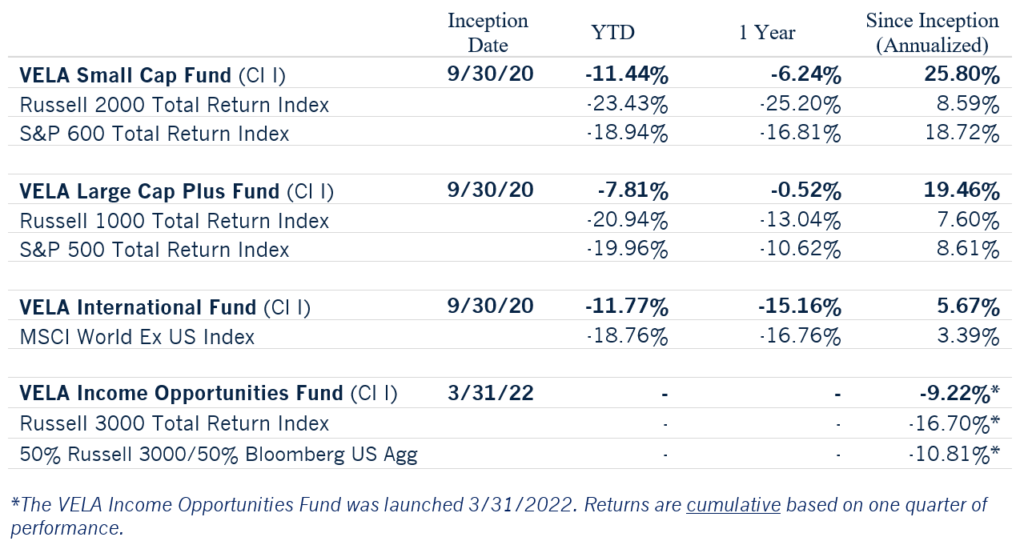
Mutual fund performance data quoted represents past performance. Past performance does not guarantee future results. The investment return and principal value of an investment will fluctuate so that an investor’s shares, when redeemed, may be worth more or less than their original cost. Current performance may be lower or higher than the performance data quoted. Investors may obtain mutual fund performance data current to the most recent month-end by calling 833-399-1001.
The total expense ratio for the VELA Funds Class I is: Small Cap VESMX 1.22%; Large Cap Plus VELIX 1.87%; International VEITX 1.22%; Income Opportunities VIOIX 0.95%.
Also weighing heavily on markets, the war in Ukraine grinds on with extreme personal hardship for the citizens of Ukraine and further isolation of Russia by the Western democracies. The E.U. and U.S. have reaffirmed their strong commitment to Ukraine, making a complete Russian victory unlikely, although they may yet secure some disputed territories in the eastern part of the country. Aside from the humanitarian crisis, the biggest economic challenge for Europe is weaning itself off Russian natural gas, a project to which European Leaders claim to be committed.
Much more important is the future of China in the world economy. Last month, the G-7 meeting concluded with a statement of concern about China’s growing aggressive behavior and tacit support for Russia. The de-globalization and re-shoring trend that began five years ago is likely to continue, and an attack on Taiwan would surely accelerate this trend.
We thank you for your support and partnership.
Sincerely,

Ric Dillon

Ric Dillon, CFA
CEO, CIO, & Co-Portfolio Manager
Ric Dillon is one of our firm’s founders and serves as Chief Executive Officer & Chief Investment Officer. Early in his career, Ric served as a Portfolio Manager for Loomis, Sayles & Company. During his tenure, the Detroit office became the top-ranking office in the company with the large cap and small cap value funds. The small cap fund that Ric started ranked number one in its Lipper category after its first twelve months of existence. While at Loomis, Ric created a new valuation model that Loomis adopted replacing the previous model of twenty-five years.
In the 1990s, Ric founded Dillon Capital Management, where he served as President and Chief Investment Officer until the company was acquired by Loomis, Sayles & Company, where he returned to work as a Portfolio Manager. In 2000 Ric founded Diamond Hill Investments, a public company (DHIL) based in Columbus, Ohio. During Ric’s tenure as CEO of the Company, Diamond Hill ranked in the top 1% of all public companies in the US in terms of shareholder total return, with an annualized total return of 27%.
Ric holds the Chartered Financial Analyst (CFA) designation. He received an MBA from the University of Dayton, as well as a M.A. in Finance and a B.S. in Business Administration from The Ohio State University.
Ric, his wife Marina and their daughter Luisa split time between homes in New Albany, Ohio and Orlando, Florida.
Investors should carefully consider the investment objectives, risks, and charges and expenses of the fund before investing. The prospectus contains this and other information about the fund, and it should be read carefully before investing. Investors may obtain a copy of the prospectus by calling 833-399-1001.
Important Information:
The Russell 2000 Index is a small-cap stock market index of the smallest 2000 stocks in the Russell 3000 Index. The S&P Small Cap 600 Index is a stock market index established by Standard & Poor’s. It covers roughly the small-cap range of American stocks, using a capitalization-weighted index.Prior to 3/1/22, the Small Cap Fund compared its performance only against the S&P Small Cap 600 Index. VELA believes the Russell 2000 Index is a more appropriate and accurate index against which to compare the Small Cap Fund’s investment strategy and, therefore, the Russell 2000 Index replaces the S&P 600 Index as the Small Cap Fund’s primary benchmark as of 3/1/22.
The Russell 1000 Index is an unmanaged market capitalization-weighted index comprised of the largest 1,000 companies by market capitalization in the Russell 3000 Index, which is comprised of the 3,000 largest U.S. companies by total market capitalization. The S&P 500 Index is a composite of 500 of the largest companies in the United States. The S&P 500 Index is unmanaged and does not represent the performance of any particular investment. Prior to 5/1/2022, the Large Cap Plus Fund compared its performance only against the S&P 500 Index. VELA believes the Russell 1000 Index is a more appropriate and accurate index against which to compare the Large Cap Plus Fund’s investment strategies and, therefore, the Russell 1000 Index replaced the S&P 500 Index as the Large Cap Plus Fund’s primary benchmark as of 5/1/2022
The MSCI World ex US Index captures large and mid-cap representation across 22 of 23 Developed Markets (DM) countries excluding the United States.
The Russell 3000 Index is a market-capitalization-weighted equity index. The index tracks the performance of the 3,000 largest U.S.-traded stocks, which collectively account for roughly 97% of all U.S.-incorporated equities. The secondary index for the fund is a blend of the Russell 3000 TR (50%) and The Bloomberg Aggregate Bond Index (50%). The Bloomberg Aggregate Bond Index broadly tracks the performance of the U.S. investment-grade bond market. The index is composed of investment-grade government and corporate bonds.
You cannot invest directly in an index.
The VELA Funds are distributed by Ultimus Fund Distributors, LLC. (Member FINRA)
VELA Investment Management, LLC is a registered investment adviser. Information presented is for educational purposes only and does not intend to make an offer or solicitation for the sale or purchase of any specific securities, investments, or investment strategies. Investments involve risk and unless otherwise stated, are not guaranteed. Be sure to first consult with a qualified financial adviser and/or tax professional before implementing any strategy discussed herein. Past performance is not indicative of future performance.
The views expressed are those of VELA Investment Management, LLC as of 07/06/2022 and are subject to change. These opinions are not intended to be a forecast of future events, a guarantee of future results, or investment advice. Third-party information in this report has been obtained from sources believed to be accurate; however, VELA makes no guarantee as to the accuracy or completeness of the information.
Control #: 15274831-UFD-7/5/2022
Footnotes:
1Yield Curve: A yield curve is a way to measure bond investors’ feelings about risk. The Treasury yield curve, which represents the rate of return for investors holding U.S. Treasury bonds, is often used as a proxy for investor sentiment on the direction of the economy. In general, short-term bonds carry lower yields to reflect the fact that an investor’s money is at less risk. The thinking behind this is that the longer you commit funds, the more you should be rewarded for that commitment, or rewarded for the risk you take that the borrower may not pay you back. This is reflected in the normal yield curve, which slopes upward from left to right on the graph as maturities lengthen and yields rise. You’ll generally see this type of yield curve when bond investors expect the economy to grow at a normal pace, without significant changes in the rate of inflation or major interruptions in available credit. There are times, however, when the curve’s shape deviates, signaling potential turning points in the economy. Historically, a flattening or inverted yield has predated a period of economic slowdown and lower interest rates. When long-term investors believe that this is their last chance to lock in current rates before they fall even lower, they become slightly less demanding of lenders. As you might expect, since lower interest rates generally mean slower economic growth, a flattening or inverted yield curve is often taken as a sign that the economy may soon stagnate.
2Credit Spread: Yields on Treasury bonds and other securities are generally among the lowest because they’re backed by the US government. This allows bond investors to compare the Treasury yield curve with that of riskier assets such as the yield curve of corporate bonds. The yield difference between the two is referred to as the “spread.” The closer the yields, the more confident investors are in taking the risk in a bond that is not government-backed. The spread generally widens during recessions and contracts during recoveries.