Dear Clients & Friends,
For the second consecutive meeting, the Federal Reserve raised its policy rate by 0.75% to a target range of 2.25-2.50%. Based on indications from the Fed to date, we anticipate an additional rate increase to come at the September meeting, with the amount to be determined as new economic data continues to become available in the interim. The European Central Bank (ECB) introduced a similarly aggressive rate hike of 0.50% in July, marking the first increase for the European Union in over a decade as the global economy struggles with rising inflation. Economic activity is beginning to slow, primarily due to higher rates worldwide, however, labor markets remain strong (albeit with low participation rates), supporting the likelihood of further rate hikes.
The war in Ukraine continues to pressure food and energy markets as Europe attempts to reduce its dependence on Russian natural gas, substituting coal and liquified natural gas imports. On a relative basis, the US benefits greatly from near energy independence, which helps to explain our strong currency relative to the Euro, Yen, and most others.
China continues to struggle with COVID, and enduring lockdowns have greatly harmed their economy. Additionally, the tremendous amount of debt in Chinese markets (related to speculative residential construction) is reminiscent of the speculative real estate activity in US markets that resulted in the 2008 financial crisis. Given both the outstanding debt and the Chinese Communist Party (CCP)’s increasingly authoritarian responses to internal problems, Chinese economic growth may fade meaningfully over the foreseeable future.
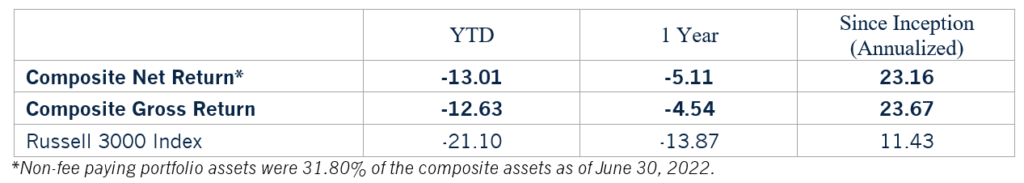
While there is significant possibility of additional near-term downside as a global economic slowdown combined with continued inflationary pressures becomes increasingly likely, long-term investors should take comfort from more accommodating valuations for both US and international stocks. We see a growing number of high-quality companies available at reasonably attractive prices and continue to reserve cash across VELA strategies to capitalize on any further declines. As shown below, we feel our valuation-focused investment approach continues to serve us well.
Total Returns (%), All Cap Concentrated Composite (as of 6/30/2022)
We thank you for your support and partnership.
Sincerely,

Ric Dillon

Ric Dillon, CFA
CEO, CIO, & Co-Portfolio Manager
Ric Dillon is one of our firm’s founders and serves as Chief Executive Officer & Chief Investment Officer. Early in his career, Ric served as a Portfolio Manager for Loomis, Sayles & Company. During his tenure, the Detroit office became the top-ranking office in the company with the large cap and small cap value funds. The small cap fund that Ric started ranked number one in its Lipper category after its first twelve months of existence. While at Loomis, Ric created a new valuation model that Loomis adopted replacing the previous model of twenty-five years.
In the 1990s, Ric founded Dillon Capital Management, where he served as President and Chief Investment Officer until the company was acquired by Loomis, Sayles & Company, where he returned to work as a Portfolio Manager. In 2000 Ric founded Diamond Hill Investments, a public company (DHIL) based in Columbus, Ohio. During Ric’s tenure as CEO of the Company, Diamond Hill ranked in the top 1% of all public companies in the US in terms of shareholder total return, with an annualized total return of 27%.
Ric holds the Chartered Financial Analyst (CFA) designation. He received an MBA from the University of Dayton, as well as a M.A. in Finance and a B.S. in Business Administration from The Ohio State University.
Ric, his wife Marina and their daughter Luisa split time between homes in New Albany, Ohio and Orlando, Florida.
VELA Investment Management, LLC is a registered investment adviser. Information presented is for educational purposes only and does not intend to make an offer or solicitation for the sale or purchase of any specific securities, investments, or investment strategies. Investments involve risk and unless otherwise stated, are not guaranteed. Be sure to first consult with a qualified financial adviser and/or tax professional before implementing any strategy discussed herein. Past performance is not indicative of future performance.
Composite Description
The “All Cap Concentrated Composite” includes all pooled funds and all fee paying and non-fee paying, taxable and tax-exempt, segregated accounts that seek to provide long-term capital appreciation by investing in a concentrated portfolio of equity investments of companies of any size market capitalization that the portfolio manager(s) believe are undervalued. The Russell 3000 Index (total return) serves as the composite’s benchmark due to the composite’s broad market capitalization and domestic company focus. Securities in the strategy are identified using a valuation-oriented, fundamental analysis approach. Key material risks include equity market risk, small cap and mid cap company risk, concentration risk, and the general risk that the composite will underperform its benchmark. The composite inception date is July 1, 2020 and the composite creation date is January 8, 2021.
Performance Calculation: Returns presented are time-weighted returns (TWR). Valuations are computed and performance is reported in U.S. dollars. The composite results reflect the reinvestment of dividends, capital gains, and other earnings. Composite returns and benchmark returns are presented gross of withholding taxes on dividends, interest income and capital gains.
Fees: Segregated Accounts: Gross returns are presented before management fees and custodial fees (if applicable) and reflect the deduction of actual transaction costs. The management fee schedule for segregated accounts is as follows: 0.75% on all assets, billed quarterly in arrears. Net returns are calculated using actual fees and deducting management fees from the monthly gross return when the quarterly management fee is assessed, generally on the final day of the last month of each calendar quarter (i.e. March, June, September, and December). Some accounts in the composite pay performance-based fees (based on relative performance to the benchmark) as part of the overall management fee structure. These performance-based fees are accrued on a quarterly basis and are reflected in the composite’s net return consistent with the timing/fee methodology described above.
Non-fee-paying portfolios are included in the composite, and the percentage of non-fee-paying portfolio assets as a percentage of composite assets is presented as of each annual period end. Composite and benchmark returns are presented gross of non-reclaimable withholding taxes.
The Russell 3000 TR Index is a market-capitalization-weighted equity index maintained by FTSE Russell that tracks the performance of the 3000 largest U.S. traded stocks across all market sectors, inclusive of dividends, capital gains, distributions, and interest. You cannot invest directly into an index.
Performance includes reinvestment of dividends and other earnings.